Something That Changes
The Idea⌗
Here is the assignment for this project:
Humans forever have been inspired by patterns in the movement of stars, planets, the moon and sun; tides, seasons, animal migrations and the blooming of plants. Inspired by astronomical instruments, select a phenomenon important to you that varies with time. This could be natural, artificial, or a combination; it could span less than a second or more than years. Devise a system (software, hardware, or both) that reflects, records, illuminates and/or amplifies the changing of the phenomenon.
For my project, I would like to create a clock that attempts to create meaning from changes in my blood sugar/glucose (bg) over time.
I am a Type 1 Diabetic. A large portion of the therapies used for managing Type 1 Diabetes (T1D) involve tracking many metrics. These include, but are not limited to: my bg, how much insulin is active in my body (on board), my basal rate (a continues amount of insulin meant to counteract glucose released by ones liver), the ratio of carbs to insulin, and so on. All of these are things that can have their values change or their own ratios change.
All of these changing values and metrics are meant to help me control or indicate my internal state as a diabetic. Are my levels in “safe” range? If they aren’t, what do I have to do to change it? What symptoms can I expect in the short term vs long term? However, none of these metrics means much for what it likes to experience any of this. I can make sense of all these terms and metrics because I have now lived with them and very much experienced the real world effects of them.
People without Type 1 Diabetes have no way of making sense of any of this. It often takes a lot of explaining to convey all the relationships between the different metrics. Only after that does the conversation shift to discussions of what it is actually like to experience. How I feel, or could feel, or expect to feel.
The clock I want to make is a device that tracks some of the metrics I have mentioned, and presents them in way that tracks more to feeling than to just displaying data points. By looking at the clock, one would not be able to tell me my exact blood sugar, but they would know if my bg was higher or lower.
I want it to give the viewer of the clock an idea of what the current set of values actually means for my experience. A way for people in my life to know my internal cycle without have to always ask me. That’s really the important part. So much of the T1D experience is internal and private. The only time it emerges or becomes apparent is when things go poorly. But the reality is these values are always in flux, and that change has real consequences for me. It affects if I’m thirsty, if I can read a book or need to lay down while my levels return to normal.
Research⌗
- Zuize - the Blood Sugar Clock
- very simple
- symptoms
- high
- frequent urination (↑)
- extreme thirst (↑)
- dry mouth (↑)
- slow healing cuts (long term)
- increased appetite (↑)
- fruity odor on the breath (↑)
- sudden weight loss (prolonged ↑)
- fatigue and weakness (↑)
- sudden vision changes (↑)
- sugar in the urine (↑)
- stupor or unconsciousness (↑)
- low
- shakiness (↓)
- nervousness or anxiety (↓)
- sweating, chills, or clamminess (↓)
- irritability or impatience (↓)
- dizziness and difficulty concentrating (↓)
- hunger or nausea (↓)
- blurred vision (↓)
- weakness or fatigue (↓)
- anger, stubbornness, or sadness (↓)
- sources
- high
- types of insulin
- rapid-acting
- start: ~15min
- duration: ~3-6hrs
- peak: ~1hr
- regular/short-acting
- start: ~30min
- duration: ~3-6hrs
- peak: ~2-3hrs
- intermediate-acting
- start: ~2-4hrs
- duration: ~12-18hrs
- peak: ~4-12hrs
- long-acting
- start: several hours after injection
- duration: ~24hrs
- peak: none
- ultra long-acting
- start: ~6hrs
- duration: ~36hrs
- peak: none
- sources
- rapid-acting
A clock with symptoms⌗
During my research, I didn’t find much in the way of clocks or art pieces that examine diabetes over time.
I did a review of the time frames for different types of insulin. This was interesting, but for what I am looking to make, it’s not really helpful. I could, in theory, make a clock that shows the overlapping time tables of different insulins or relative time frames of each injection of insulin someone takes. But, T1Ds usually take one or two, not all the different kinds. So, showing the relative time frames of insulin onboard (injected and not all used up yet) could be something. However, it doesn’t reveal much about the experience of being a T1D.
I also reviewed the symptoms of T1D. The symptoms depend on whether a person is experiencing a high blood sugar or low blood sugar. Also, some of the symptoms only emerge after a prolonged high or low (and some only emerge after years). This gave me an idea - to create a clock thats usability is determined by the symptom’s it is “experiencing”. The symptoms will be tied to the real blood sugar of a person with T1D.
So, here is the full idea. The clock will be a “normal” clock; it will display the time. The clock will receive blood sugar data at the rate a Continuous Glucose Monitor (CGM) can produce it (usually once every 5 minutes). If the persons blood sugar starts to rise, the clock will begin to exhibit more and more high blood sugar symptoms. Eventually, the clock will “pass out”. The same will be true for low blood sugars.
Highs and lows, and their corresponding symptoms have different timetables. For example, it may take an hour at a high blood sugar before a person start to become dehydrated. But, it may only take 5 minutes for someones mood to change when they have a low. The clock will reflect this. I want to use the “normal” UI of a clock (digital or analog at this point) to express these symptoms.
I am going to make this clock in software. Another iteration of this clock would be physical. So, a small desk clock or a clock that is hung on the wall. For this midterm though, it will be a software clock.
To build a clock with T1D⌗
There are 3 main components I need to figure out. First, what symptoms do I want to use. Second, how will those symptoms be expressed. Third, what is the timetable for these symptoms (based on blood sugar data received).
Also, the criteria for a high or low need to be established. A high is blood sugar over 120. A severe high is a blood sugar of 200+. A low blood sugar is 69 or lower. A severe low is 40 or lower. This reveals that the range for lows is less than for highs. The timetable for lows and the corresponding symptoms is much faster than it is for highs.
Symptoms to use⌗
These symptoms were selected from the list I collected.
- high
- frequent urination
- slow healing cuts
- recovery is slow
- sudden vision changes
- stupor or unconsciousness
- low
- shakiness
- nervousness or anxiety
- dizziness and difficulty concentrating
- blurred vision
- shakiness
Symptom expression and timetable⌗
- effects:
- high:
- +1 hr -> alarm goes off (gets louder and quicker)
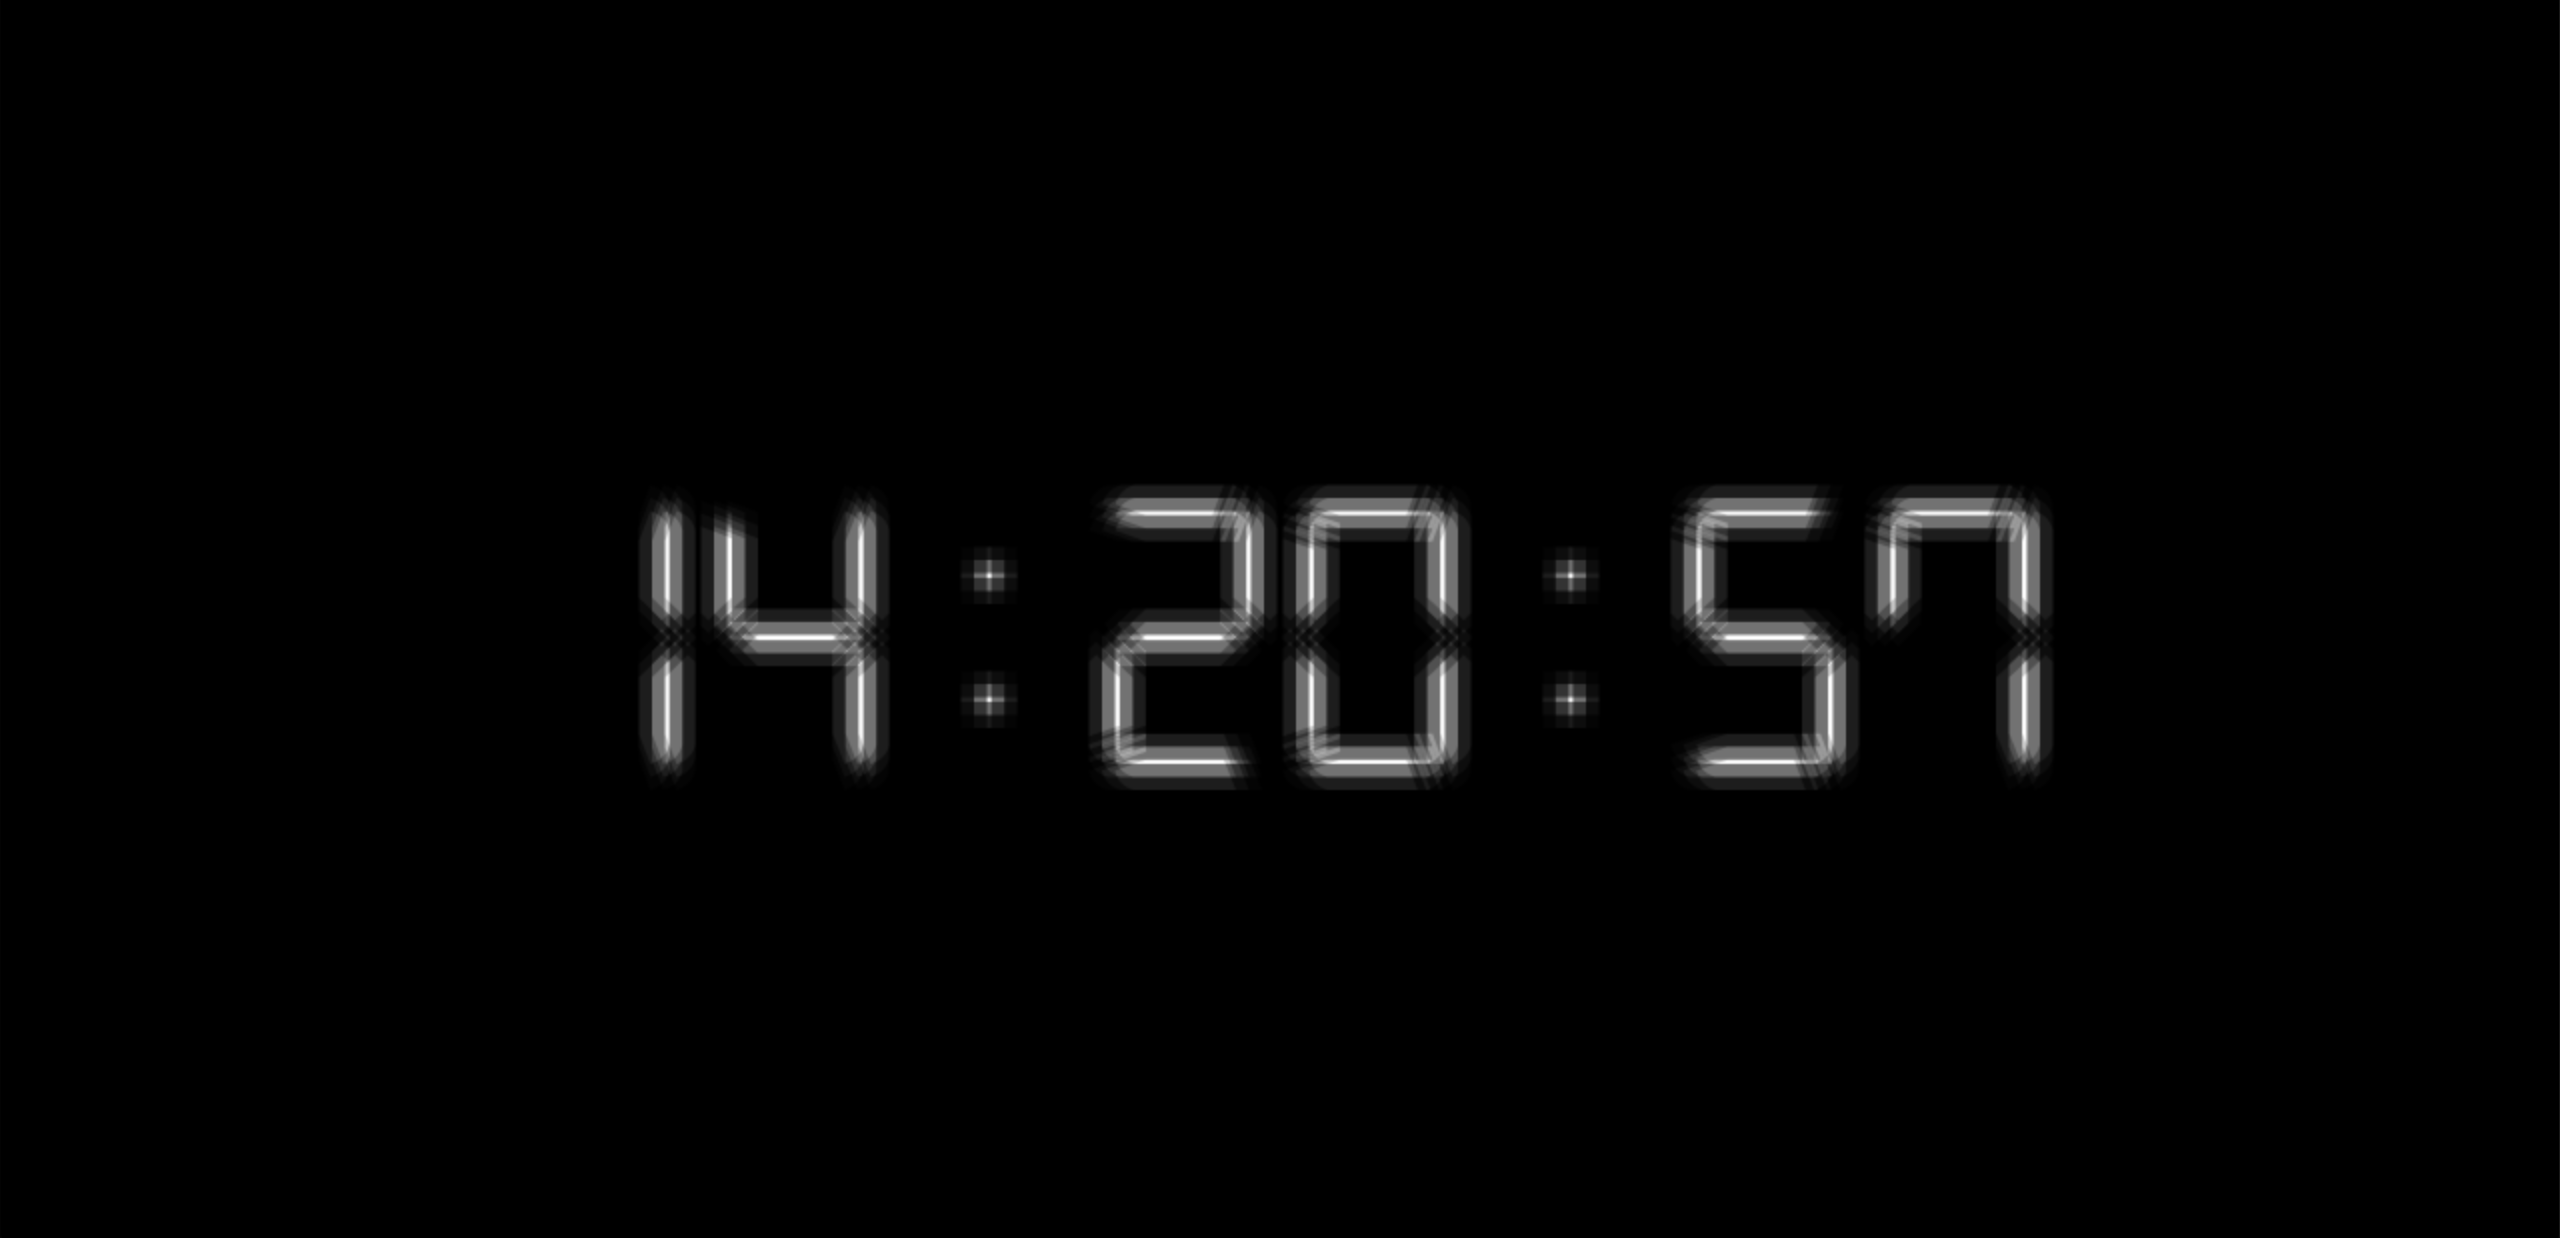
- +2 hrs -> the clock face will become blurry
- +3 hrs -> the clock face will begin to fade out until it full disappears
- for every high within a 24hr period, the clock takes that much longer to return to baseline
- low:
- +10 min -> the clock face will shake
- +20 min -> drift from the center of the UI and rotate slightly
- +30 min -> min the clock face will begin to fade out until it full disappears
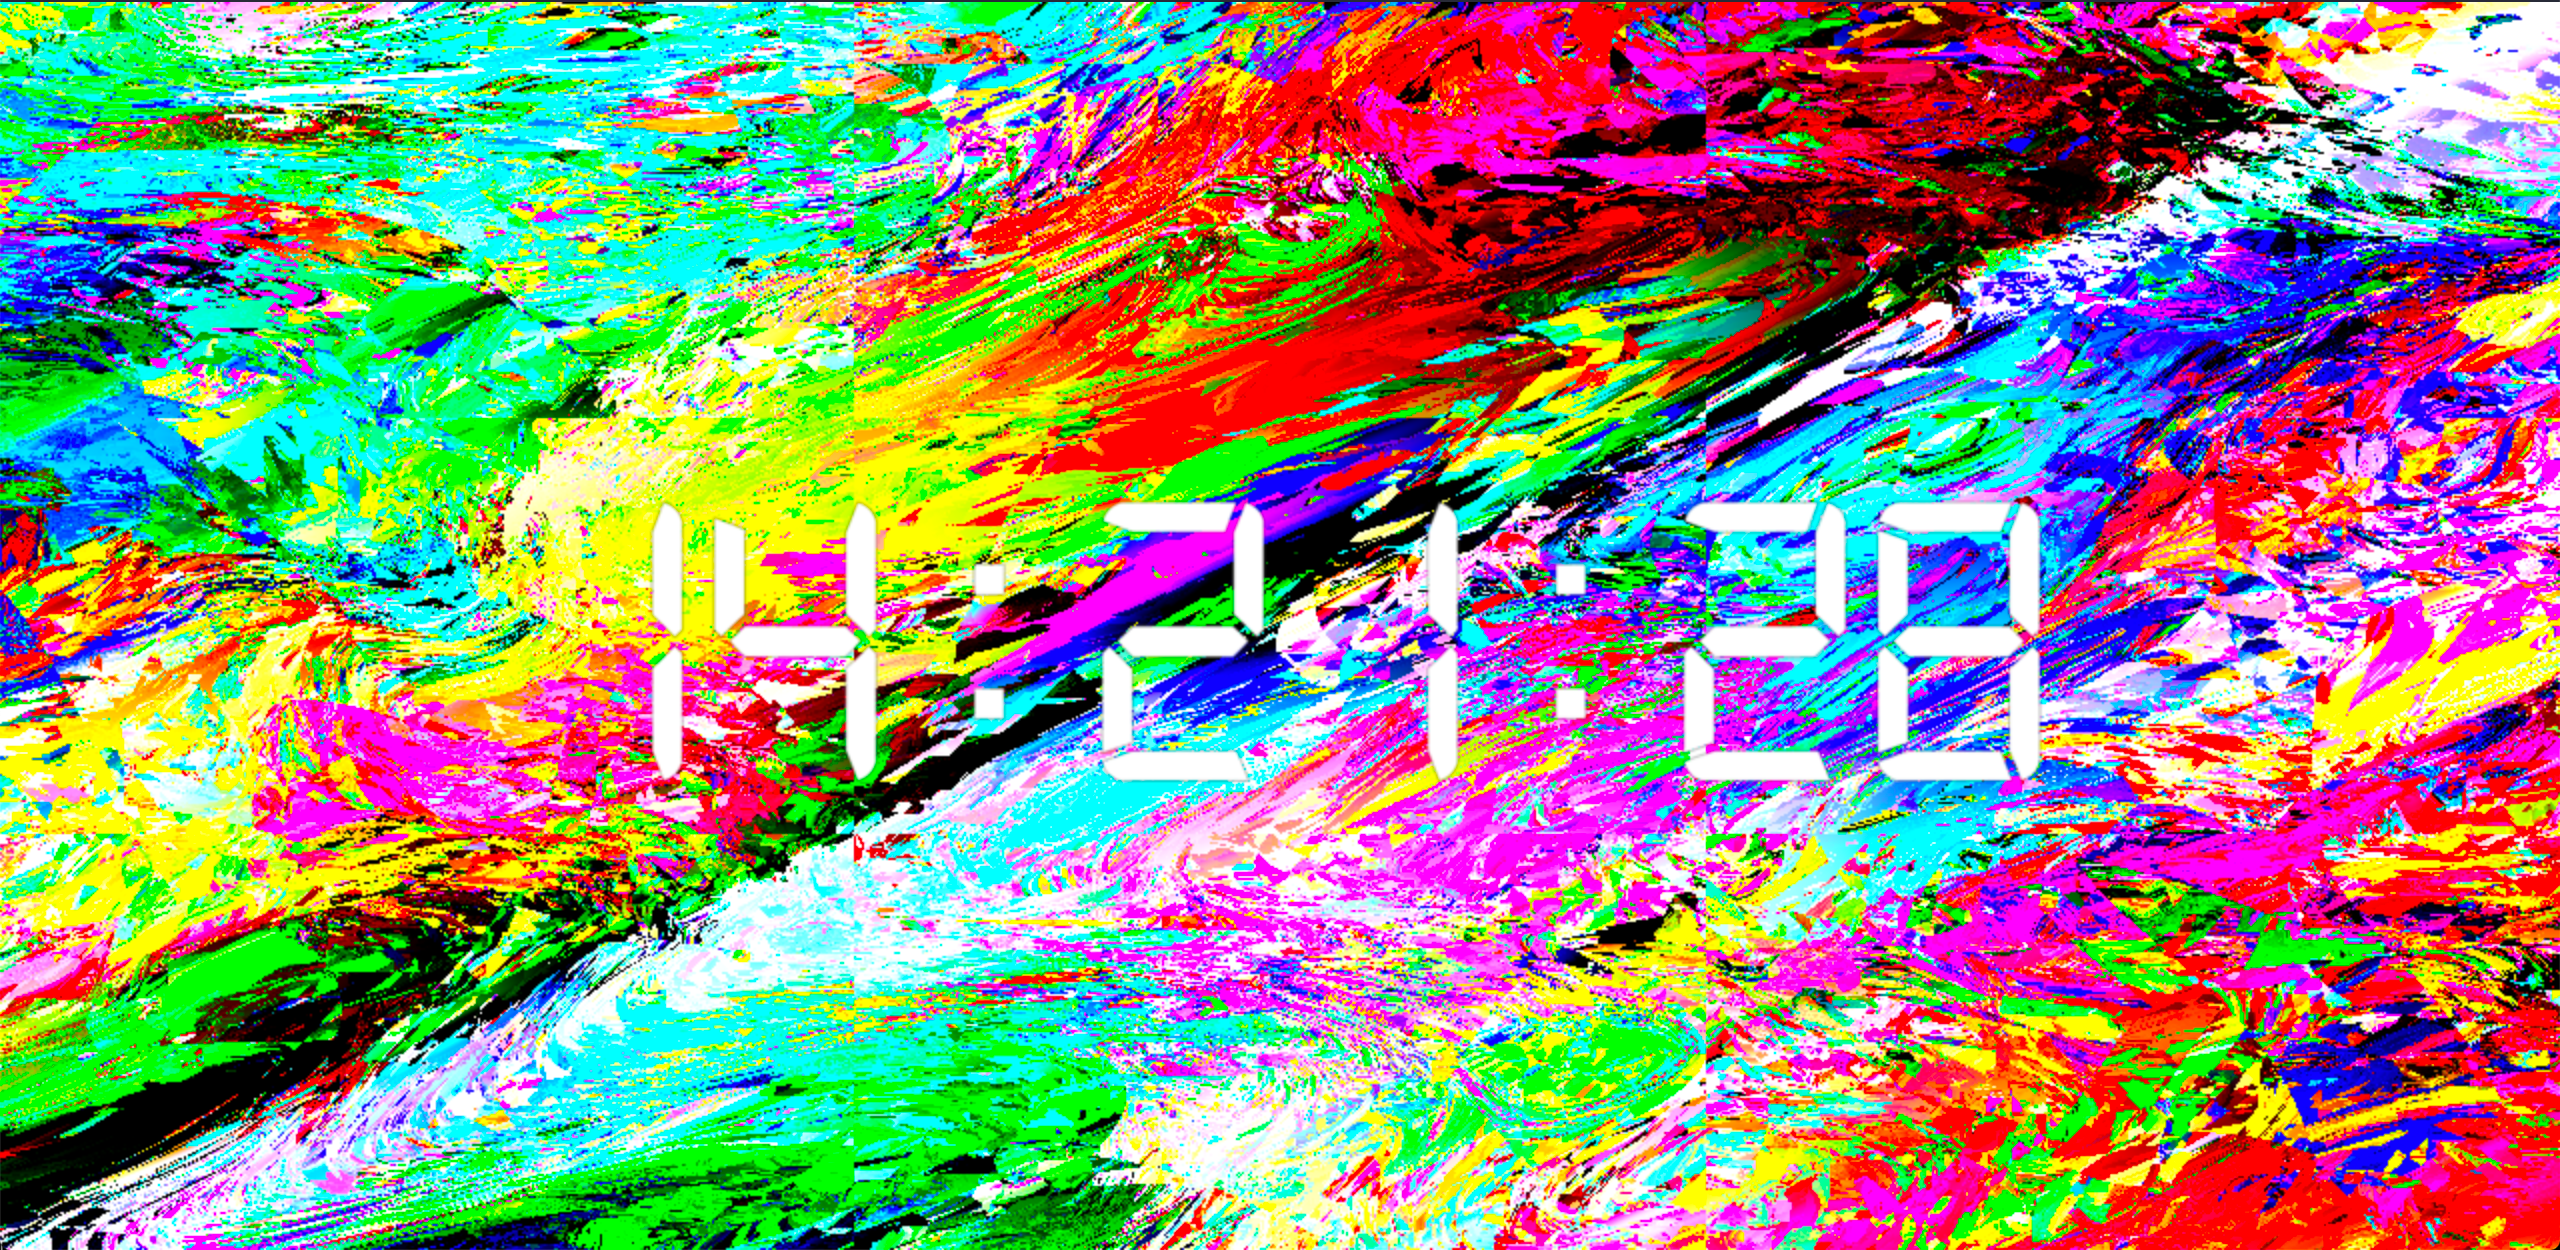
- severe lows -> shader color effect
- high:
The final thing⌗
Repository for code for clock: something_that_changes
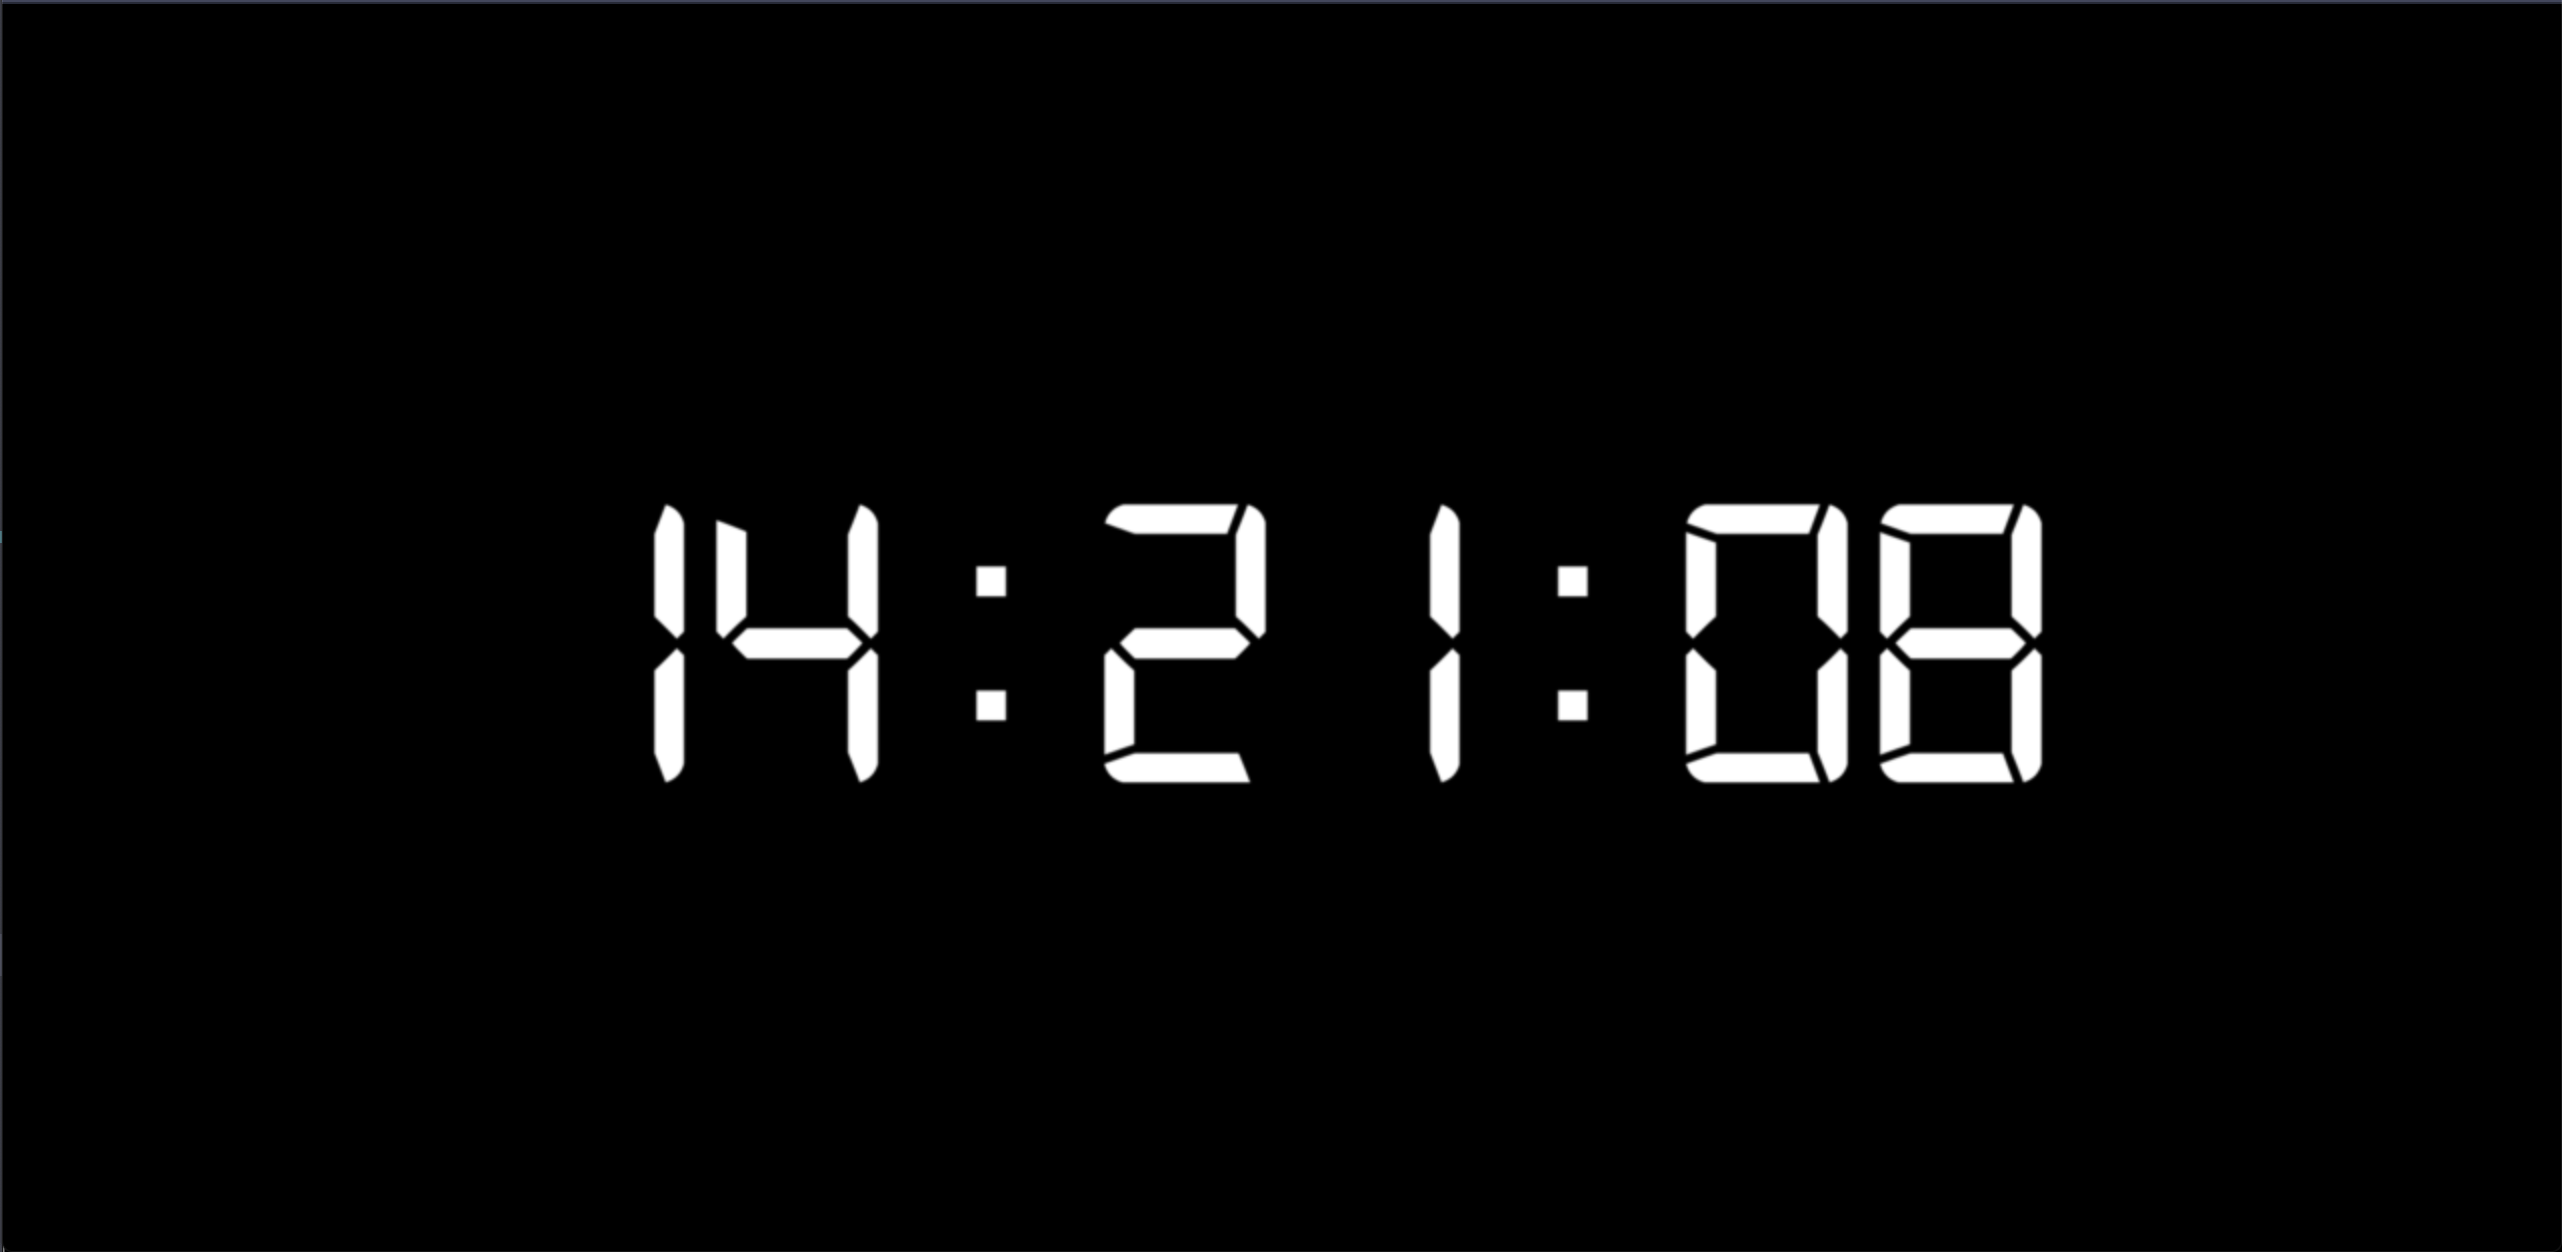
Here is what the clock normally looks like. It shows hours (uses 24 hours instead of two, 12 hour cycles), minutes, and seconds. The digits are white on a black background.
This is a still of the clock face blurring. It is about halfway to full blur.
The last one is an example of a severe low. The background becomes an array of colors.